Discovery
|
Melvin Lye, Christoph Eberle, PhD
Automating Antibody Cocktail Prep: The C-FREE™ Advantage
For flow cytometrists, pipetting antibody master mixes directly from vials without lifting a finger is a convenience long sought
There is a scientific and economic case for standardization in flow cytometry. Antibody cocktail preparation underpins reproducibility and analytical precision. It is a critical control point that enhances data quality, operational efficiency, and regulatory confidence in immunostaining experiments. In drug development, where time and cost efforts directly influence clinical decisions or program outcomes, automating this step can significantly de-risk workflows. Yet, manual cocktailing remains one of the most variable and labor-intensive stages during immunophenotyping. Each pipetting step introduces opportunities for deviation in volume or concentration, errors that compound as the complexity of the panel increases.
In high-dimensional immunophenotyping, where 24- to 30-marker panels are now common, even small volumetric variations can propagate across controls and samples, leading to costly QC failures or irreproducible data1,2. Automating this process replaces manual uncertainty with programmable precision, ensuring every run is executed with consistent volumes, timing, and traceability.
From Variability to Precision
Manual preparation of antibody cocktails can involve dozens of pipetting steps per run, introducing significant operator-dependent variability and increasing the likelihood of error2. The C-FREE™ Pluto LT and MT Workstations automate antibody cocktail preparation, staining, and washing in a single, walk-away protocol. Validation studies demonstrate intra- and inter-assay coefficients of variation (CV) below 2% across replicate preparations, well within the reproducibility thresholds defined by CLSI H62. Each Pluto system digitally logs volumes, timestamps, and reagent identifiers, generating a traceable audit trail suitable for 21 CFR Part 11 and GxP compliance9. Automation standardizes assay execution across operators and facilities, directly improving reproducibility and simplifying audit readiness.
Expanding Antibody Panel Sizes in Flow and Spectral Cytometry
Over the past decade, cytometry has transitioned from conventional multi-color systems (~10 markers) to high-parameter spectral cytometry, which is now routinely capable of detecting 40+ markers per run. This expansion enables deeper biological discovery but dramatically increases the burden of antibody cocktailing and QC. Key drivers of this trend include:
• Spectral unmixing algorithms, which allow simultaneous detection of overlapping fluorochromes3, 8.
• Advanced lasers and detectors, which have expanded the usable fluorescence range3.
• Computational pipelines (e.g., FlowSOM, UMAP). These now handle high-dimensional data, motivating large panels4,5.
Figure 1. Growth in Typical Flow Cytometry (FCM) Panel Size (2010 – 2024); (Illustrative trend based on peer-reviewed literature and vendor specifications)
Year | Conventional FCM (Markers) | Spectral FCM (Markers) | Source |
|---|---|---|---|
2010 | 8 – 10 | — | Perfetto et al., Nat. Rev. Immunol., 20042 |
2015 | 12 – 16 | — | Thermo Fisher Scientific Application Notes, 2015 |
2018 | 18 – 25 | 25 – 30 | Thermo Fisher Scientific, Spectral Flow Cytometry, 2021 |
2020 | 25 – 28 | 30 – 35 | Schlenner S., KU Leuven, 20236 |
2022 | 28 – 30 | 35 – 40+ | Sharma et al., Nat. Methods, 20243; BD Biosciences, Spectral Flow Cytometry Overview |
2024 | 30+ | 40 – 50+ | BD Biosciences, Spectral Flow Cytometry Overview; Astakhova EA et al. Int. J. Mol. Sci., 20248 |
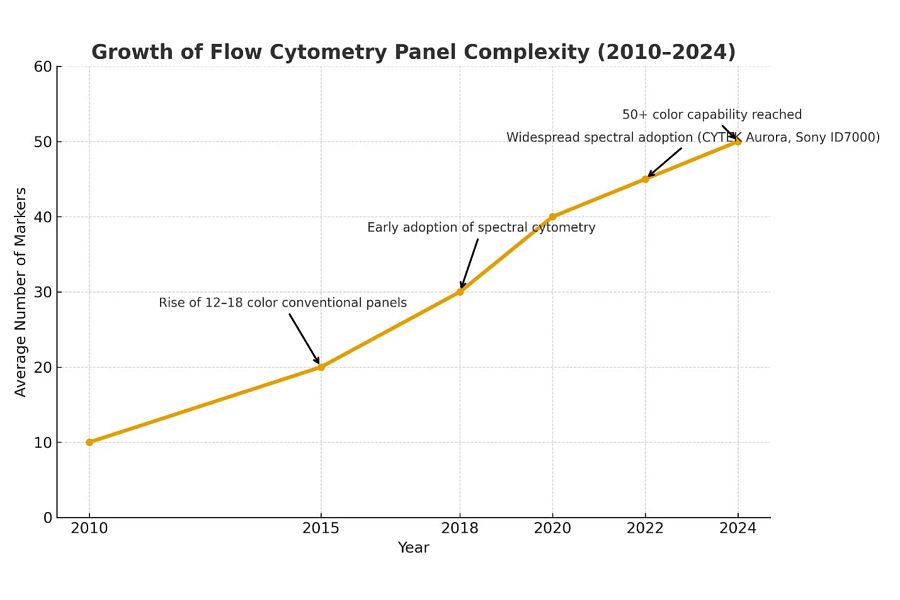
Panel dimensionality has quadrupled since 2010, increasing from ~10 to more than 40 markers3,6,8. As panel size expands, manual cocktail preparation becomes exponentially more complex, requiring precise reagent tracking, volumetric accuracy, and documentation, capabilities ideally suited to automated platforms. High-dimensional flow cytometry, defined by the simultaneous measurement of 20 or more markers, inherently operates with a non-linear cost structure. As technical complexity increases, the financial risks associated with labor and quality control (QC) errors multiply.
Reagent Expenditure and the Barrier to Entry
The foundation of flow cytometry costs lies in specialized antibody reagents. While standardized, lower-parameter panels (e.g., 8–10 color TBNK assays) can be accessed commercially at a relatively predictable cost (approximately US$715–$729 per 100 tests), the financial outlay is far greater for advanced, custom, high-parameter assays. The development and internal verification of robust panels spanning 30 to 40 markers is a critical, expensive undertaking. Commercial services for custom panel validation and optimization, including clone selection, conjugation, and titration analysis, can command costs starting at $15,000 per panel. This massive initial investment establishes a high financial barrier and underscores the severe consequences of subsequent failures during sample processing. When a complex batch fails due to a preparation error, the loss is predominantly the high-value, low-volume reagents.
The Multiplier Effect of Quality Control: FMO Controls
The necessity for rigorous quality control escalates with panel complexity. As the number of fluorophores increases, the potential for spectral overlap and fluorescence spillover requires meticulous calculation of compensation. Fluorescence Minus One (FMO) controls are crucial for accurately determining the appropriate gating boundary between positive and negative events and for assessing the spread of signals across detectors, particularly in large multicolor experiments.
For a large panel (e.g., 30 markers), running 6 to 8 critical FMO controls is standard practice. Each FMO tube contains nearly the full complement of the panel (e.g., 29 out of 30 antibodies). If an error occurs in the creation of the master antibody cocktail, such as an operator mis-pipetting one key component volume, the error is instantly propagated to every FMO tube derived from that cocktail. This results in the compounded loss of all reagents used for the master cocktail, as well as the large volume of reagents designated for all associated FMOs. The consensus in the literature acknowledges that FMO controls are crucial for standardization in large-scale experiments, and failure to maintain this standardization can lead to bias and clinically significant discrepancies in quantitative test results. Automation of FMO preparation guarantees consistency between the master cocktail and the controls, thereby protecting the massive, sunk costs represented by the necessary control matrix.
Let’s explore this through a thought experiment grounded in a typical industry scenario: running an unspecified 20-marker OMPI panel and a 10-color TBNK panel on several thousand samples over one year. Particularly, the latter is a staple assay in immunology, oncology, and vaccine development targeting T cells, B cells, and NK cells. But to generate reproducible results across thousands of samples, laboratories must precisely and consistently prepare antibody cocktails, often manually, bringing three critical challenges:
• High labor cost and time consumption
• Increased reagent waste
• Human error and data variability
Table 1: TBNK Annual Operational Cost Calculation (e.g. 9,600 Samples)
Cost Component | Calculation Basis | Estimated Annual Cost (USD) | Strategic Note |
Reagent Kit (10-color TBNK) | 9,600 × $7.22/test | $69,312 | Predictable base reagent cost |
Additional Reagents / Consumables | 15% of kit spend = 0.15 × 69,312 | $10,397 | Buffer, lysing, plastics; variable but modest |
Manual Antibody Cocktail Labor (prep only) | 0.5 hr/run × 100 runs × $40/hr | $2,000 | Uses your “30 min per run” manual assumption |
Manual QC / Remake Premium (3%) | 3% × (69,312 + 10,397 + 2,000) | $2,451 | Captures reagent + overage + labor already spent |
Estimated Total (Manual Prep) | Sum of above | $84,160 | Updated baseline TCO for manual cocktailing only |
Table 2: Operational Cost Calculation: High-Color OMIP Manual Workflow (e.g. 1,000 Samples p.a.)
Cost Component | Calculation Basis | Manual (USD) | Strategic Implication |
Base Reagents (≥20 markers) | 1,000 × $150 | $150,000 | High sunk cost; fidelity critical |
Reagent Overhead / Residual | Manual 20% of base; Automated ≤5% | $30,000 | Automation converts variable waste to fixed, auditable residual |
Antibody Cocktail Labor | Manual: 1.5 hr/run × 100 × $40 | $6,000 | Operator time drops >85% at cocktailing step |
Volatility / Remake Premium | Manual 15% of base; Automated 2% of base | $22,500 | Standardized dispensing reduces re-runs |
FMO / Control Overhead | Manual 10% of base; Automated 6% of base | $15,000 | Scripted FMOs/control matrices lower recurring control burden |
Estimated Total | Sum of above | $223,500 |
Table 3: Quantifying the Economic Impact
Workflow | Manual Preparation | Automated with C-FREE™ Pluto | Quantified Effect |
10-Color TBNK (9,600 samples / 100 runs) | • 0.5 hr/run × 100 = 50 labor hrs ($2,000) • 15% reagent overage ($10,296) • 3% QC remake rate ($2,100) Total: $14,396 | • 0.17 hr/run × 100 = 17 labor hrs ($680) • ≤ 5% reagent residual ($3,430) • 1% QC remake ($700) Total: $4,810 | ≈ $9,600 savings (≈ 67% reduction) |
20-Marker OMIP (1,000 samples / 100 runs) | • 1.5 hr/run × 100 = 150 labor hrs ($6,000) • 20% reagent overage ($30,000 est.) • 10% remake rate ($15,000) Total: $51,000 | • 0.17 hr/run × 100 = 17 labor hrs ($680) • ≤ 5% residual ($7,500) • 2% remake ($3,000)
Total: $11,180 | ≈ $39,800 savings (≈ 78% reduction) |
These values align with published assessments of automated liquid-handling precision in micro-volume workflows7.
Flow cytometry measurement quality
“The cost of reproducibility is not additive—it’s transformative.”9 Antibody cocktailing precision matters for immunophenotyping reliability. Small shifts in marker intensity due to inconsistent staining can lead to the misclassification of cell populations, affecting downstream decisions such as biomarker discovery, immunogenicity assessments, or patient stratification. In clinical or regulated research settings, such variability can invalidate entire datasets. What does automating antibody cocktail preparation mean in real-world terms?
1. Labor Component: Automation reduces operator engagement at the antibody cocktailing step by ~70%, freeing ~130–140 hours annually that can be redeployed to analysis and QC.
2. Reagent Stability: Pluto’s pipette-controlled, low-dead-volume dispensing converts a variable 15-20% reagent overage into a fixed, auditable ≤ 5% residual.
3. QC Savings: By standardizing pipetting and mixing, automated workflows lower QC remake frequency from 3-10% to below 2%, protecting both reagent and sample material.
4. Overall ROI: Even though antibody cocktail prep represents a small fraction of total assay cost, automation delivers $10K-$40K in direct savings per year per workstation, with break-even achieved within 12 months under standard utilization (100 runs/year).
The Broader Implication: Reproducibility Has a ROI
Automation’s financial value stems from predictability, not just cost savings. Manual workflows generate volatile expenses due to variable reagent loss and operator error. Automation stabilizes those costs, establishing a consistent, auditable baseline that aligns with clinical and CRO financial governance9. For research organizations and contract partners, predictable assay performance and fixed cost structures protect margins and support scalability as flow cytometry migrates toward regulated clinical applications3,6.
As automation, AI-driven QC, and digital traceability converge, laboratories are transitioning from reactive process control to proactive reproducibility design3, 8. The C-FREE™ Pluto™ ecosystem embodies this evolution, automating antibody cocktailing and washing while ensuring that every run is documented, auditable, and reproducible. In flow cytometry, the true cost of an assay is not its antibody list price; it is how many times it must be repeated. By automating antibody cocktailing, C-FREE™ Pluto™ transforms every experiment into a standardized, traceable, and reproducible event, scientifically robust and economically sustainable.
References:
1. Valle A, Maugeri N, Manfredi A. et al. Standardization in flow cytometry: correct sample handling as a priority. Nat Rev Immunol, 2012, 12:864. doi: 10.1038/nri3158-c3.
2. Perfetto S, Chattopadhyay P, Roederer M. Seventeen-colour flow cytometry: unravelling the immune system. Nat Rev Immunol, 2004, 4:648-655. doi: 10.1038/nri1416
3. Sharma S, Boyer J, Teyton L. A practitioner’s view of spectral flow cytometry. Nat Methods, 2024, 21:740-743. doi: 10.1038/s41592-023-02042-3.
4. Ujas TA, Obregon-Perko V, Stowe AM. A guide on analyzing flow cytometry data using clustering methods and nonlinear dimensionality reduction (tSNE or UMAP). Methods Mol Biol., 2023, 2616:231-249. doi: 10.1007/978-1-0716-2926-0_18.
5. Couckuyt A, Rombaut B, Saeys Y, Van Gassen S. Efficient cytometry analysis with FlowSOM in python boosts interoperability with other single-cell tools. Bioinformatics, 2024, 40: btae179. doi: 10.1093/bioinformatics/btae179.
6. Schlenner S. Full Spectrum Flow Cytometry for High-Parameter Analysis. KU Leuven (2023).
7. SPT Labtech. Automation Accuracy in Micro-Volume Workflows. Technical Guide, 2022.
8. Astakhova EA, Gubaeva AS, Naumova DA, et al. Spectral flow cytometry: the current state and future of the technology. Int J Mol Sci., 2025, 26:5911. doi: 10.3390/ijms26125911.
9. American Society for Clinical Pathology (ASCP). Flow Cytometry Financial Management Module. 2024.