Which Human Regulatory T Cells (Tregs) Best Suit Your Research Needs?
Human regulatory T cells represent only about 1–4% of the peripheral blood mononuclear cells (PBMCs). This makes Tregs difficult to isolate due to their rarity. Our Treg product portfolio includes natural regulatory T cells, expanded regulatory T cells, and induced regulatory T cells. Find which Treg cells best fit your research needs by learning more below:
-
Natural Regulatory T Cells (nTregs)
Available in a 2 M vial size. Natural Regulatory T cells are isolated directly from a leukapheresis collection (leukopak), which is collected at our donor center from healthy donors that have consented under an IRB approved protocol. Natural Tregs are immediately cryopreserved following isolation and therefore don’t undergo any further manipulation or culturing following isolation. The most widely accepted and classical phenotype for natural Tregs is the co-expression of CD4 and CD25 surface markers and the absence of CD127 expression on the cell surface with additional intracellular expression of FoxP3. Natural Tregs are critical to the maintenance of immune cell homeostasis as they can suppress the activation and expansion of other T cells.
-
Expanded Regulatory T Cells (eTregs)
Available in a 2 M vial size. This Treg population is obtained by in vitro expansion of the natural Tregs following isolation from a leukapheresis collection (leukopak). Expanded Tregs retain the classical Treg immunophenotype i.e., CD4+, CD25+, and CD127-, with expression of transcription factor FoxP3 (Figure 1 A-C), as well as the immunosuppressive activity of natural regulatory T cells (Figure 1D).
Phenotype of Expanded Tregs Co-cultured with Allogenic CD8+ T cells
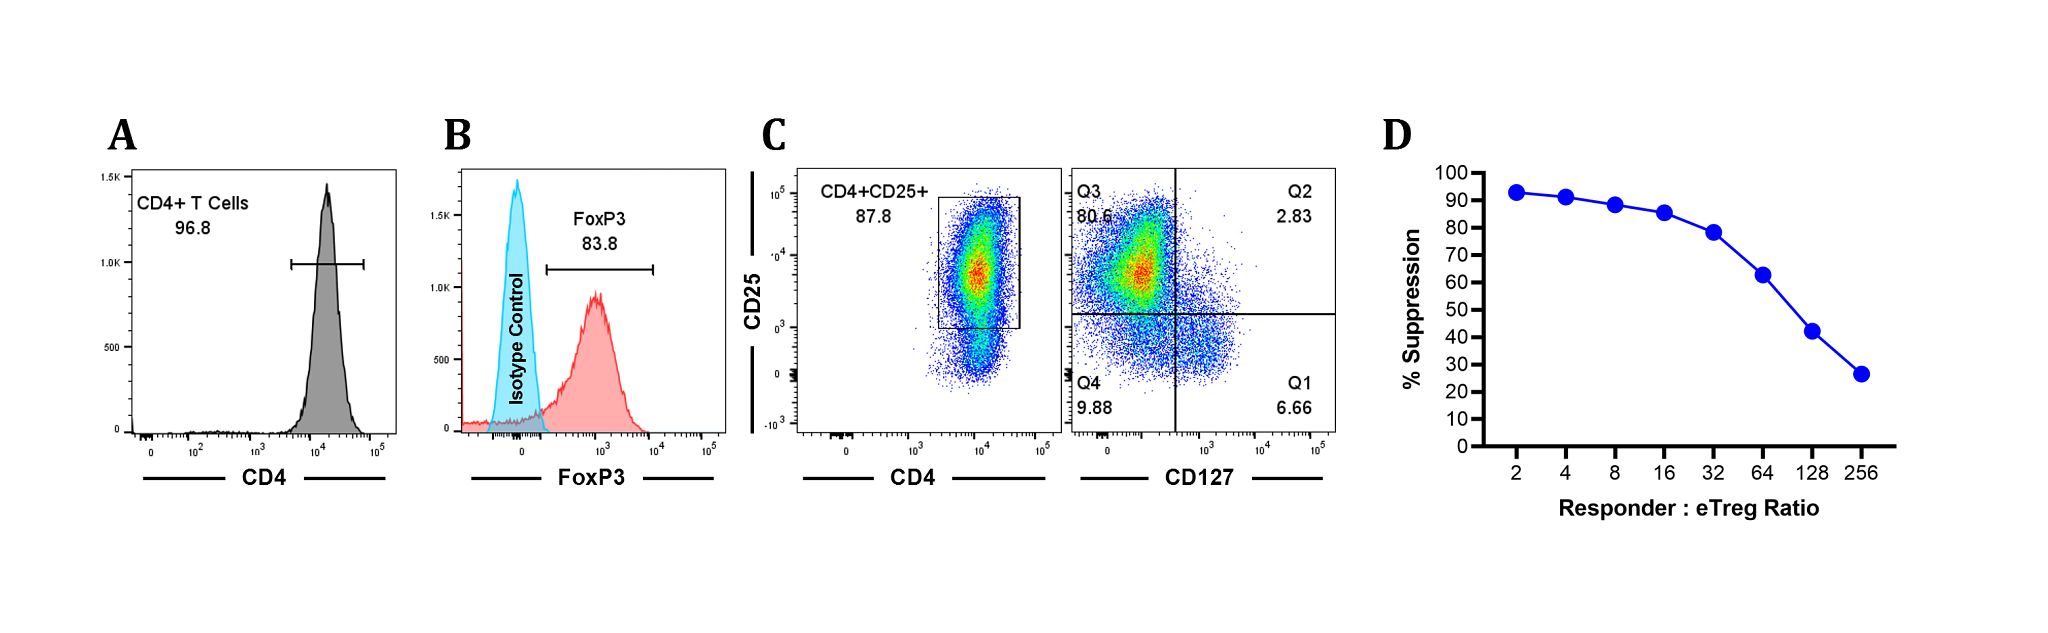
Figure 1: Expanded Tregs (eTregs) are characterized by high expression of CD25 and FoxP3 and exhibit immunosuppressive activity. A. Histogram of CD4+ T cells. B. Expression of FoxP3 along with isotype control. C. Expanded Tregs were characterized by high expression of CD25 and low expression of CD127. D. The immunosuppressive potential of expanded Tregs was evaluated by a suppression assay. This method measures the capacity of expanded Tregs to suppress the proliferation of effector CD8 T cells in vitro. Co-culture of expanded Tregs and responder T cells resulted in suppression of anti-CD3-mediated CD8+ T cell proliferation of allogeneic PBMCs. In a 96 well plate, 250,000 CFSE-labelled allogeneic responder PBMCs were plated/well in the presence of 0.2 µg/mL anti-CD3 and serially diluted expanded Tregs at responder to expanded Treg ratio shown in the figure above. The plate was incubated at 37º C, 6% CO2. After 5 days of culture, individual wells were harvested and stained with APC-labelled anti-CD8 mAb. Dilution of CFSE as indicator of cell division was acquired on a flow cytometer and the extent of proliferation (Division Index, DI) was analyzed using FlowJo10.8.1. % Suppression was calculated as 100 - (DI in the presence of expanded Treg/DI in the absence of expanded Treg) x 100.
-
Induced Regulatory T Cells (iTregs)
Available in a 2 M vial size. Induced Treg cells are differentiated in vitro by stimulating CD4+ T cells in the presence of IL-2, TGF-β and rapamycin. While natural Tregs are characterized by expression of FoxP3, induced Tregs that are differentiated in vitro do not constitutively express high levels of FoxP3 and are characterized by high expression of CD25, PD1 and CTLA-4 with low expression of CD127. Expression of the inhibitory molecules PD1 and CTLA-4 by induced Tregs may play an important role in their suppressive activity (Figure 1). Despite lack of FoxP3 expression, we demonstrate comparable suppression of effector CD8+ T cell proliferation by expanded regulatory T cells and induced Tregs (Figure 2). Furthermore, suppressive activity is agnostic to whether induced Tregs are derived from naïve CD4+T cells or responder (CD4+CD127+CD25-) T cells. Additionally, our data shows that human regulatory T cells can suppress both effector CD8+ T cell proliferation in response to CD3 cross-linking and NY-ESO-1-specific CD8+T cell cytotoxicity of the A375 tumor cell line (Figure 3).
Phenotype of Induced Tregs Co-cultured with Allogenic CD8+ T cells
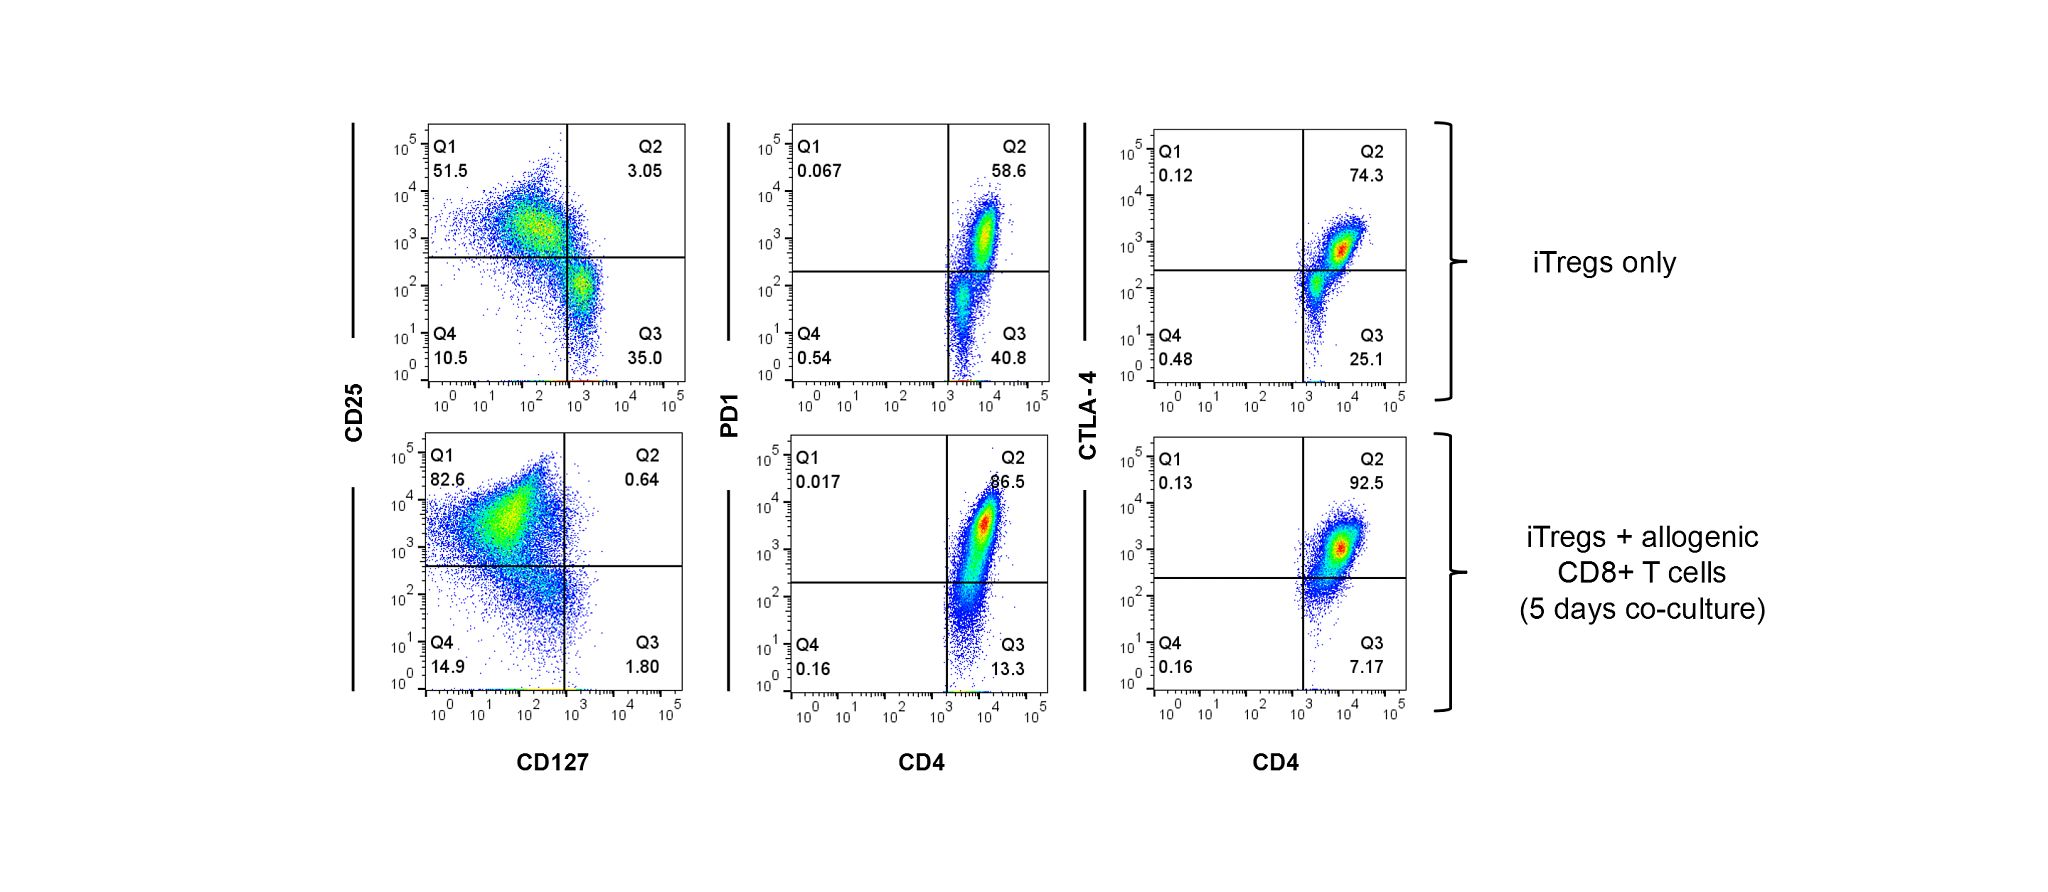
Figure 1: High expression of CD25 and inhibitory molecules (PD1 and CTLA-4) by induced Tregs after 5 days in co-culture with CFSE-labelled allogeneic PBMCs. A. Induced Tregs were characterized by high expression of CD25, PD1 and CTLA-4 and low expression of CD127 when cultured alone. B. Expression of CD25 and the inhibitory molecules PD1 and CTLA-4 was significantly increased by induced Tregs following co-culture with allogeneic PBMCs. Induced Tregs did not express FoxP3.
Suppression of Allogenic CD8+ T Cells Proliferation by Induced Tregs
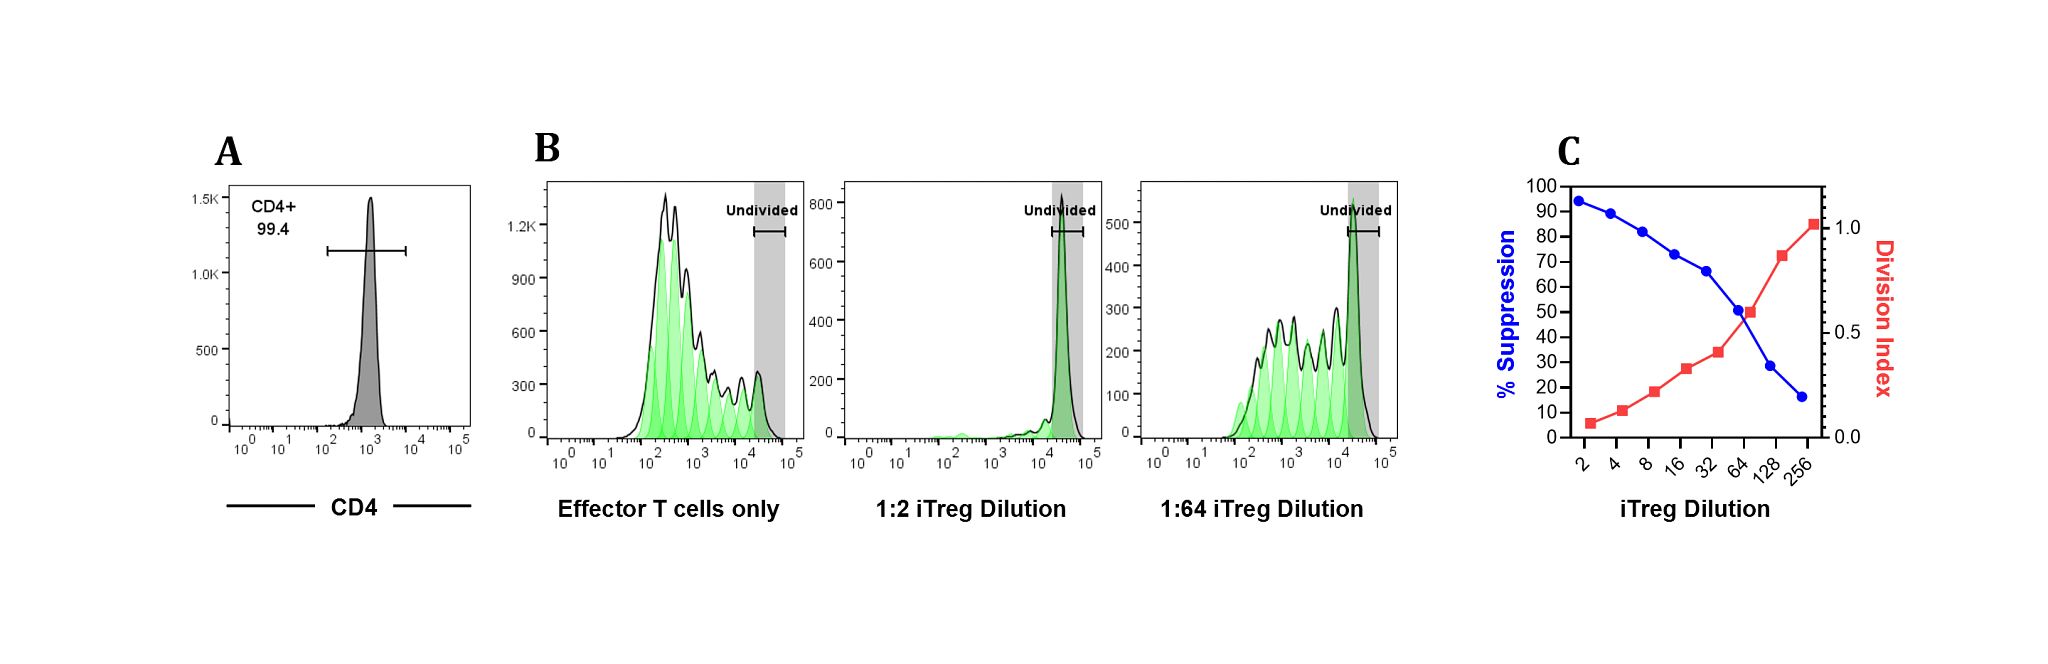
Figure 2: The immunosuppressive potential of induced Tregs was evaluated by a suppression assay. This method measures the capacity of induced Tregs to suppress the proliferation of effector CD8+ T cells in vitro. Briefly, in a 96 well plate, 250,000 CFSE-labelled allogeneic PBMCs were plated/well in the presence of 0.2 µg/mL anti-CD3 alone or in co-culture with induced Tregs at various ratios as indicated. The plate was incubated at 37 °C, 5% CO2. After 5 days of culture, individual wells were harvested and stained with APC-labelled anti-CD8 antibody. Flow cytometry was performed on the APC-gated CD8+ effector cell population. Dilution of CFSE as indicator of cell division was acquired on a flow cytometer and the extent of proliferation (Division Index, DI) was analyzed using FlowJo10.8.1. Percentage of suppression was calculated as 100 - (DI in the presence of induced Tregs/DI in the absence of induced Tregs) x 100. A. Histogram of CD4+ T cell. B. Effector CD8+ T cells without induced Tregs showed multiple rounds of cell division. Co-culture of effector T cells with lowest dilution (1:2) of induced Tregs completely suppressed the proliferation of effector T cells in response to CD3 crosslinking. C. As the number of induced Tregs was decreased (serially diluted as indicated), the suppressive effect on effector CD8+ T cells was lifted.
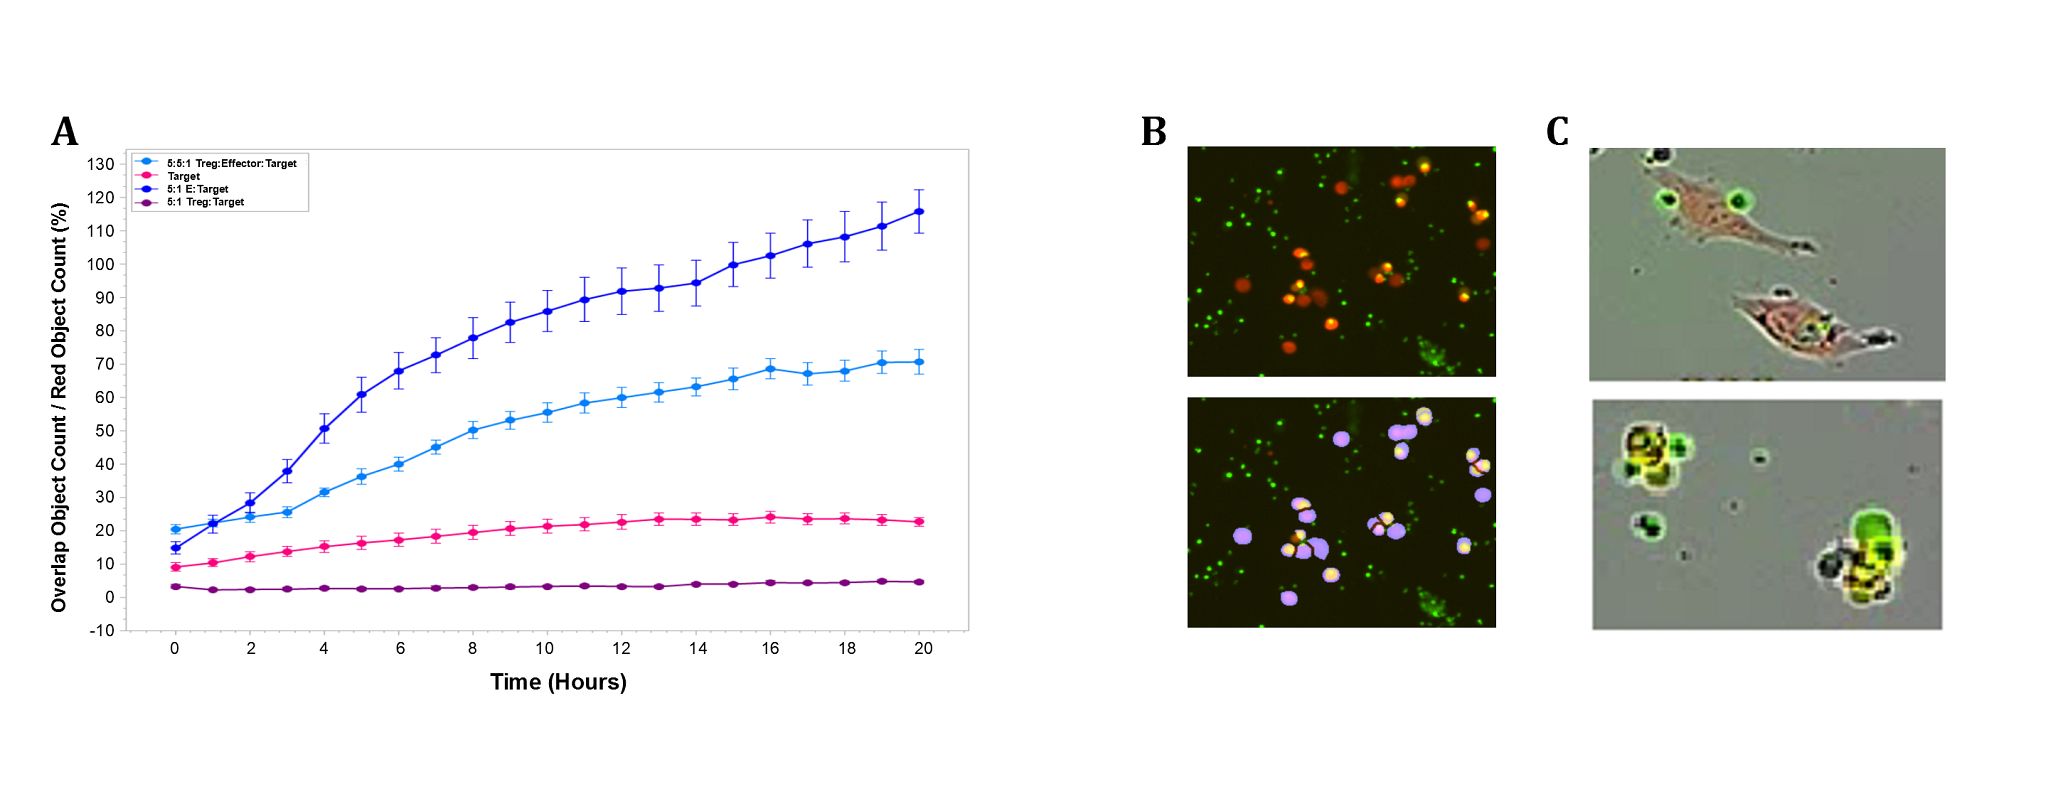
Figure 3: Induced regulatory T cells suppressed antigen-specific CD8+ T cell cytotoxicity (NY-ESO-1, SLLMWITQC, 151-165) of NY-ESO-1 expressing A375 cancer cells. A. Antigen-specific cytotoxicity is reduced with the addition of induced Tregs at 1:1 ratio (induced Treg:CD8+ T cell) (light blue) when compared to antigen-specific CD8+ T cells with A375 cell (dark blue) alone. B. Image of cytotoxic T cell killing (top panel) and cell mask overlay (bottom panel). Note that blue mask represents Cytolight Red (A375, target cell) staining, yellow mask represents red/green overlap where cell selection includes only lymphocyte size-excluded, caspase 3/7 green labeled cells and target A375 cell Cytolight Red labeled cells. C. Dual cell image is representative of T cell attachment to A375 at 1-hour post-T cell addition (Top). At 10 hours, T cells are interacting with A375 target in late-stage apoptosis, indicated by cell blebbing and bright caspase 3/7 staining (green). Image capture and analysis performed at 37 °C, 5% CO2 using Incucyte S3 Live-cell analysis system. Antigen-specific CD8+ T cell killing of NY-ESO-1 expressing A375 target cells was observed in 96 well format over 20 hours.
Regulatory T Cells (Tregs): Ally and Nemesis
Are you interested in working with regulatory T cells (Tregs)? Join us as we share impactful data showcasing phenotypic and functional characterization of natural, expanded, and induced Tregs, as well as Treg-mediated suppression of antigen-specific cytotoxicity against cancer cells.
Reserve Your Seat
Learn More About Human Regulatory T Cells (Tregs)
Human regulatory T cells (Tregs) are key modulators of immunological self-tolerance and homeostasis, maintaining the balance between pro-and anti-inflammatory responses. Decrease in Treg numbers and activity are associated with autoimmunity such as with arthritis and lupus, while increase of Tregs in tumor infiltrating lymphocytes is associated with cancer progression. Thus, a better understanding of regulatory T cell activity is paramount to dissect its role in immune homeostasis and tolerance.
The majority of these regulatory T cells are produced in the thymus (natural Tregs) and can also be expanded in culture (expanded Tregs) from natural T regs. Some regulatory T cells differentiate from conventional T cells in the body (induced Tregs). In addition, induced regulatory T cells (induced Tregs) can also be produced in vitro from conventional T cells following T cell receptor stimulation in the presence of IL-2, TGF-β and rapamycin.
While both natural and expanded Tregs are characterized by expression of FoxP3, induced Tregs that are differentiated in vitro do not constitutively express high levels of FoxP3. A summary of regulatory T cell phenotype in terms of marker expression is shown in table 1.
| Regulatory T cells | CD4+ | CD25+ | CD127+ | FoxP3+ |
|---|---|---|---|---|
| Natural Tregs | Yes | Yes | No | Yes |
| Expanded Tregs | Yes | Yes | No | Yes |
| Induced Tregs | Yes | Yes | No | No |
Table 1: Regulatory T cells phenotype in terms of marker expression
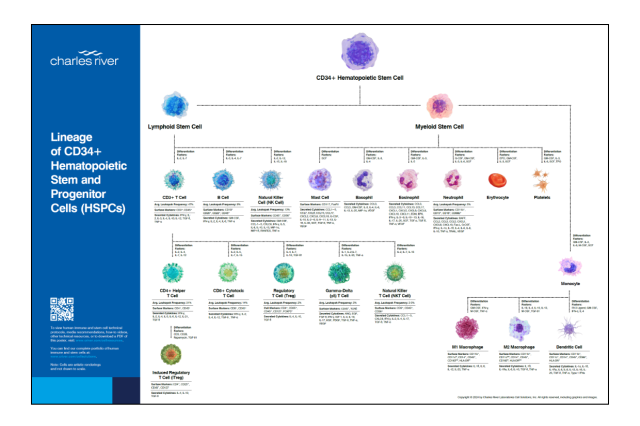
Lineage of CD34+ Hematopoietic Stem and Progenitor Cells (HSPCs)
Receive a complimentary poster to access information on immune cell markers, differentiation factors, cytokines, technical protocols, media recommendations, how-to videos, and more.